18 Jan 2022
Samuel Mauchlen BVM&S, MRCVS and Chris Dixon BVSc, CertVOphthal, MRCVS in the first of a two-part article, discuss the indications for this assessment, as well as technique and eye anatomy.
The use of ocular ultrasonography has become a standard imaging technique in veterinary ophthalmology. It is used routinely to evaluate ocular and orbital structures.
In the first of two descriptive articles focusing on ocular ultrasonography, the indications, technique, and normal appearance of the eye in canine and feline patients will be discussed.
Indications for ultrasonographic assessment of the eye and orbit include:
CT and MRI are complementary techniques that can provide excellent detail of the orbital and periorbital structures, but normally require sedation or general anaesthesia1.
Both these imaging modalities can use contrast‑enhanced techniques using iodinated or gadolinium contrast agents, respectively. This can aid detection of some pathological conditions by highlighting vascular structures and changes within the vascular supply to ocular anatomy or pathological lesions2.
Ultrasound biomicroscopy uses very high frequency ultrasound transducers capable of producing frequencies of 50MHz or greater. This ultrasound technology is predominantly used in specialist clinical and research settings to evaluate the anterior ocular structures, including the cornea, anterior chamber and iris3.
Optical coherence tomography is a non‑invasive scanning laser that can be used to obtain very high-resolution images for ocular biometry. The machines are extremely expensive, and the latest models are capable of retinal angiography without contrast agents. Undoubtedly, refinement of the technology for the veterinary market will continue, although its usefulness may be limited to referral clinics.
The aforementioned detailed modalities are all valuable in the assessment of ocular and orbital structures, although the expense and expertise involved in each limits its availability.
In comparison, ultrasonography offers a widely available and safe imaging modality.
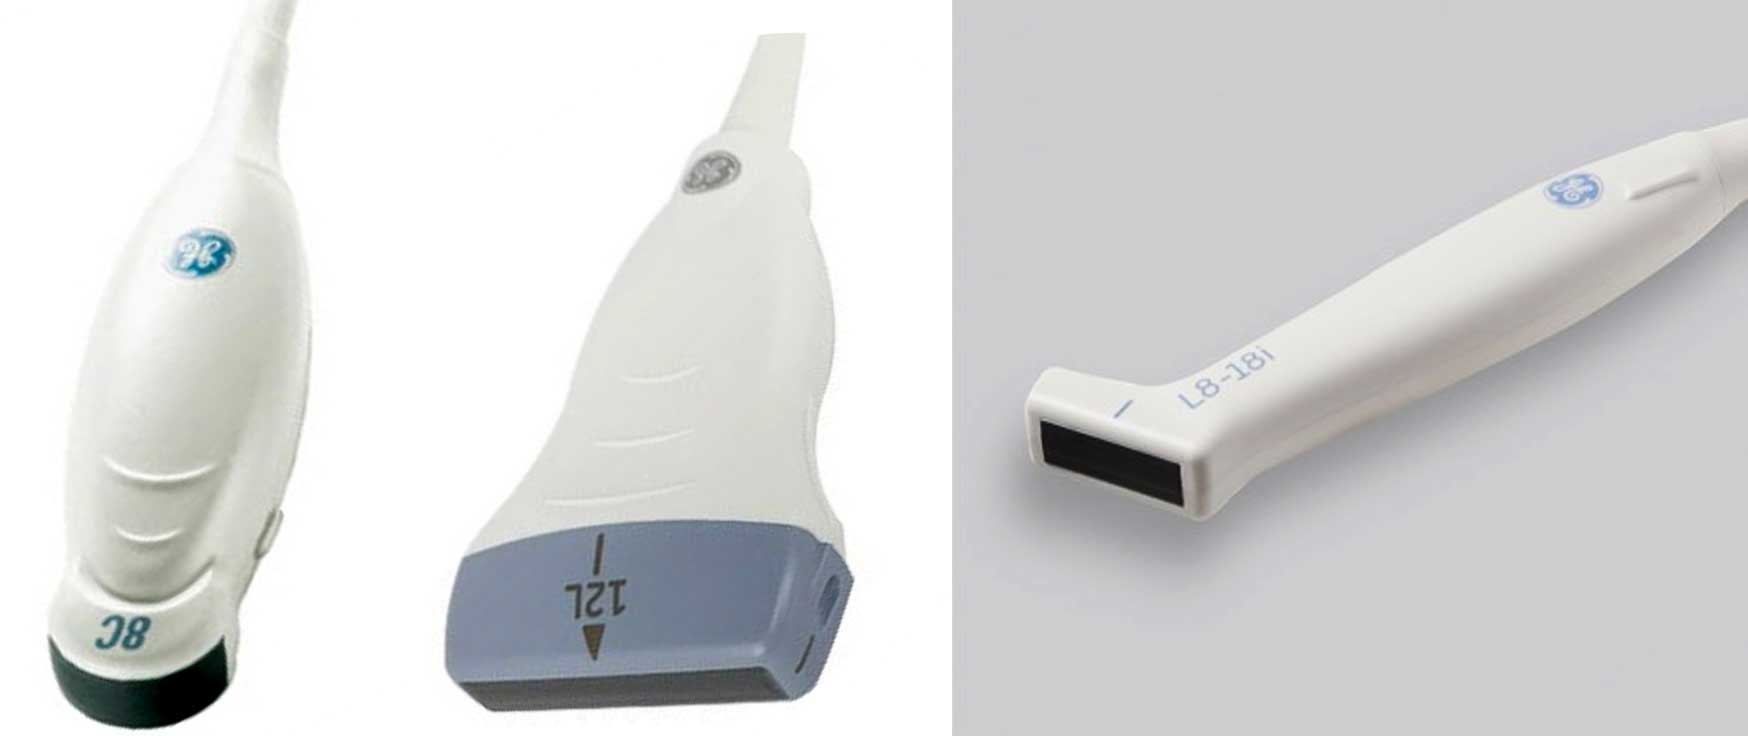
Given the superficial nature of the ocular structures, adjusting the ultrasound machine settings and choosing the optimal transducer (probe) from those available is important.
Medium to high‑frequency transducers capable of producing ultrasound frequencies of between 12MHz and 20MHz are ideal for imaging intraocular structures.
As ultrasound frequency increases, the resolution of the image improves, although greater attenuation of the ultrasound beam exists, reducing tissue penetration.
Transducers capable of producing higher frequencies will provide superior resolution images of the anterior ocular structures, and lower‑frequency transducers (or using a lower frequency setting) can be useful when examining the posterior globe and retrobulbar tissue.
Linear or curved (micro-convex) transducers are commonly used during ultrasonographic assessment of ocular tissues. Linear transducers are often capable of producing
higher‑frequency ultrasound waves, although the curved surface and smaller footprint of a convex probe can often be easier to manoeuvre around the eye (Figure 1).
Depth and focal zone should be altered to optimise the image quality. Depth should be set so the area of interest occupies approximately two‑thirds to three‑quarters of the screen. The focal zone represents the area of optimal lateral resolution and should be positioned at the same level as or just below the area of interest.
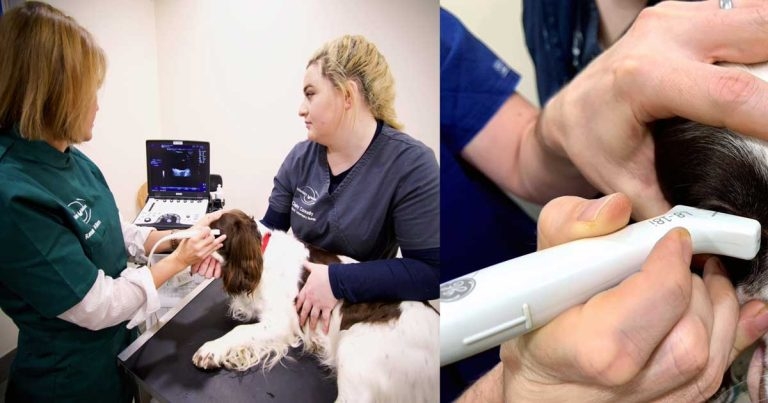
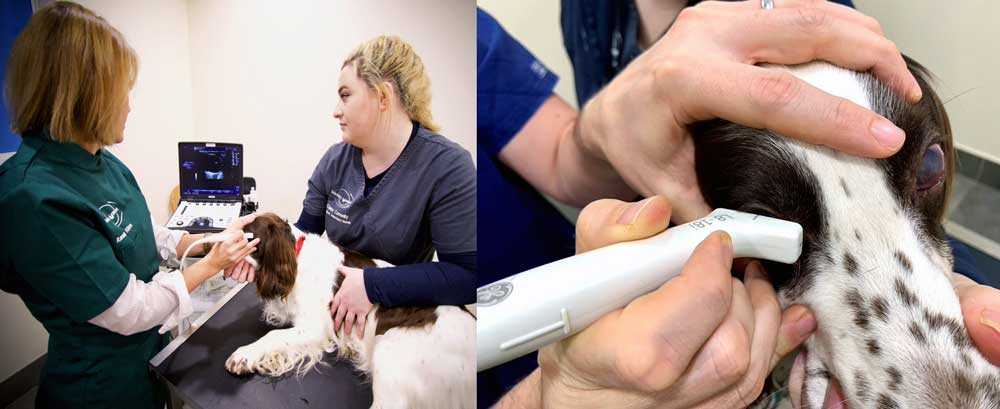
Ocular ultrasonography is ideally performed with patients conscious, as sedation or general anaesthesia will often lead to retraction and rotation of the globe, which can affect image quality and orientation.
Patients can be allowed to stand or sit with the head held securely by an assistant. Sternal or lateral recumbency can also be used if necessary (Figure 2).
Prior to the examination, a topical local anaesthetic – such as one to two drops of 0.5 per cent proxymetacaine – should be applied to the corneal surface.
A water-soluble acoustic coupling gel can then be applied to the probe, and the probe placed

directly on the corneal surface.
In cases with intense blepharospasm, corneal damage or globe trauma, or where the patient is uncooperative, the eye can be imaged through the skin of the closed eyelid. However, the image quality may be compromised in comparison to a direct corneal placement of the probe.
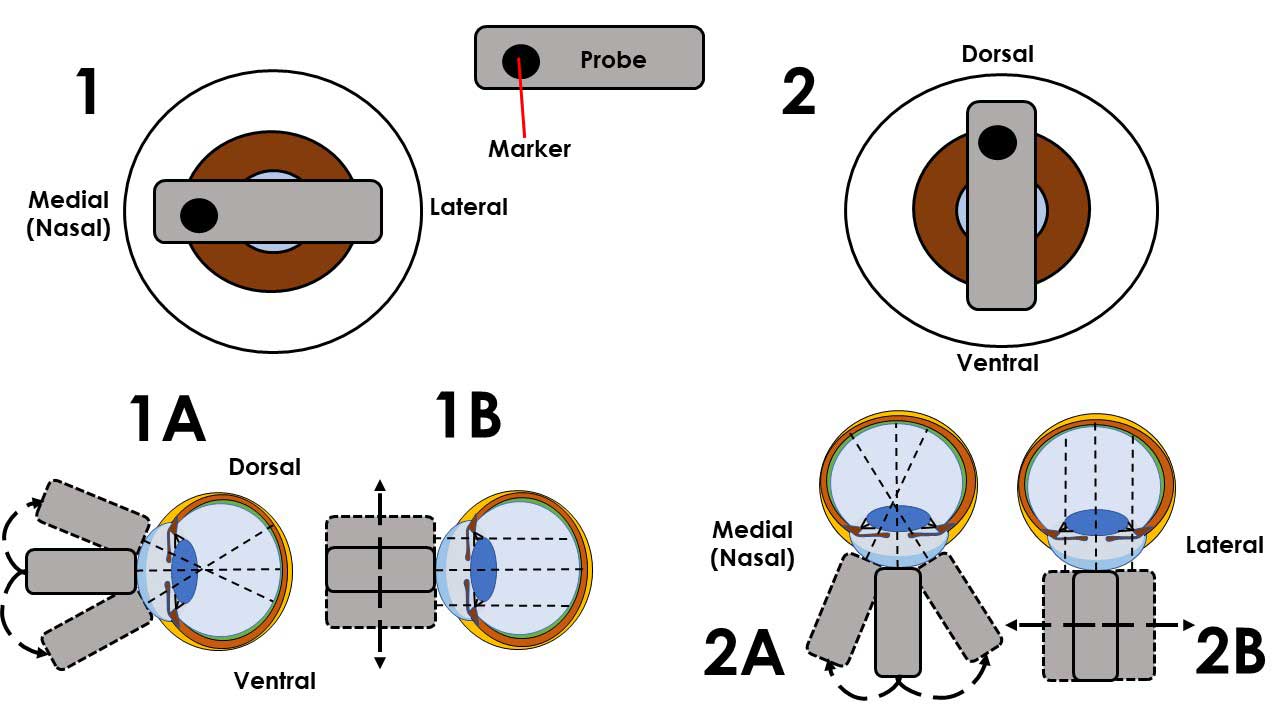
Once positioned, the probe marker can be used for orientation. The authors would recommend medial (nasal) marker positioning for horizontal plane imaging, and dorsal positioning for vertical plane imaging. From each of these positions the probe can be fanned (angled) or slid, allowing the eye to be examined thoroughly in two orthogonal planes (Figure 3).
It is important to examine both eyes as this will allow a direct comparison between the normal and affected eye.
Following the examination, any gel can be gently flushed from the ocular surface using warm, sterile fluid. Given the delicacy of the ocular tissues, it may be preferential to use single‑use acoustic coupling gel to reduce the risk of contamination from a larger multi‑use bottle.
The retrobulbar structures can be visualised using the aforementioned trans-corneal technique, and it is possible to acquire images by positioning the probe over the temporal fossa.
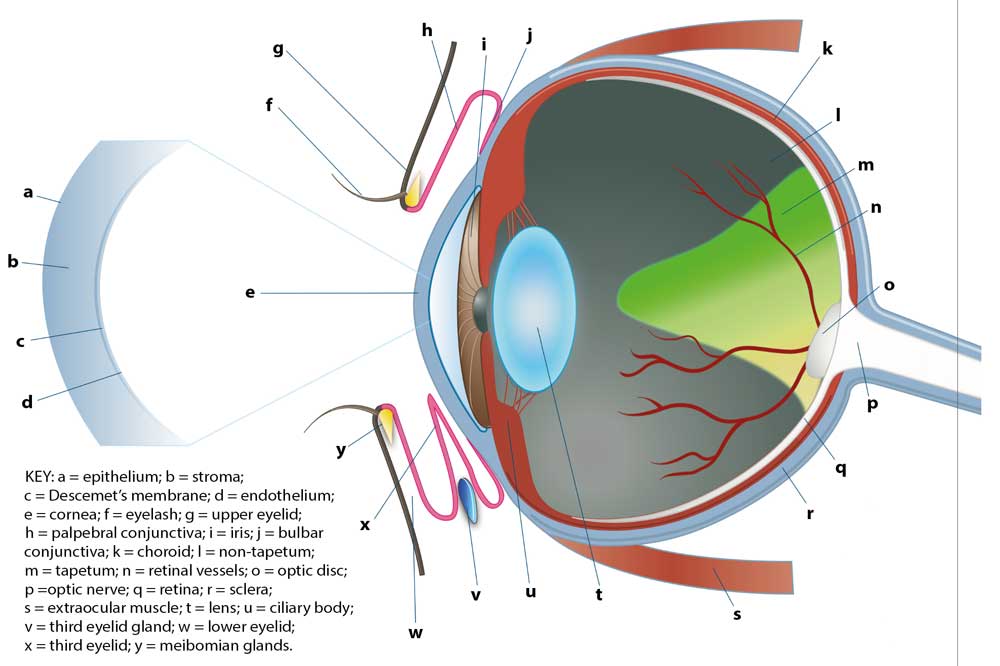
A schematic illustration of the ocular anatomy can be seen in Figure 4.
The normal cornea appears as a curvilinear hyperechoic structure that can be split into three parallel layers using a high‑frequency transducer (Figure 5).
The anterior convex hyperechoic layer is the epithelium, the central anechoic middle layer is the stroma and the hyperechoic posterior layer is the endothelium.
Flattening of the corneal surface can occur if too much pressure is applied from the transducer, and an adequate application of an acoustic coupling gel must be used.
The anterior chamber is the space between the posterior surface of the cornea and the anterior surface of the iris. The posterior chamber is the narrow triangular space posterior to the iris and anterior to the lens.
Both the anterior and posterior chamber are filled with aqueous humour and are anechoic.
The iris is an echogenic structure that tapers towards the pupillary margin and appears continuous with the ciliary body. The ciliary processes may be visualised with higher resolution transducers.
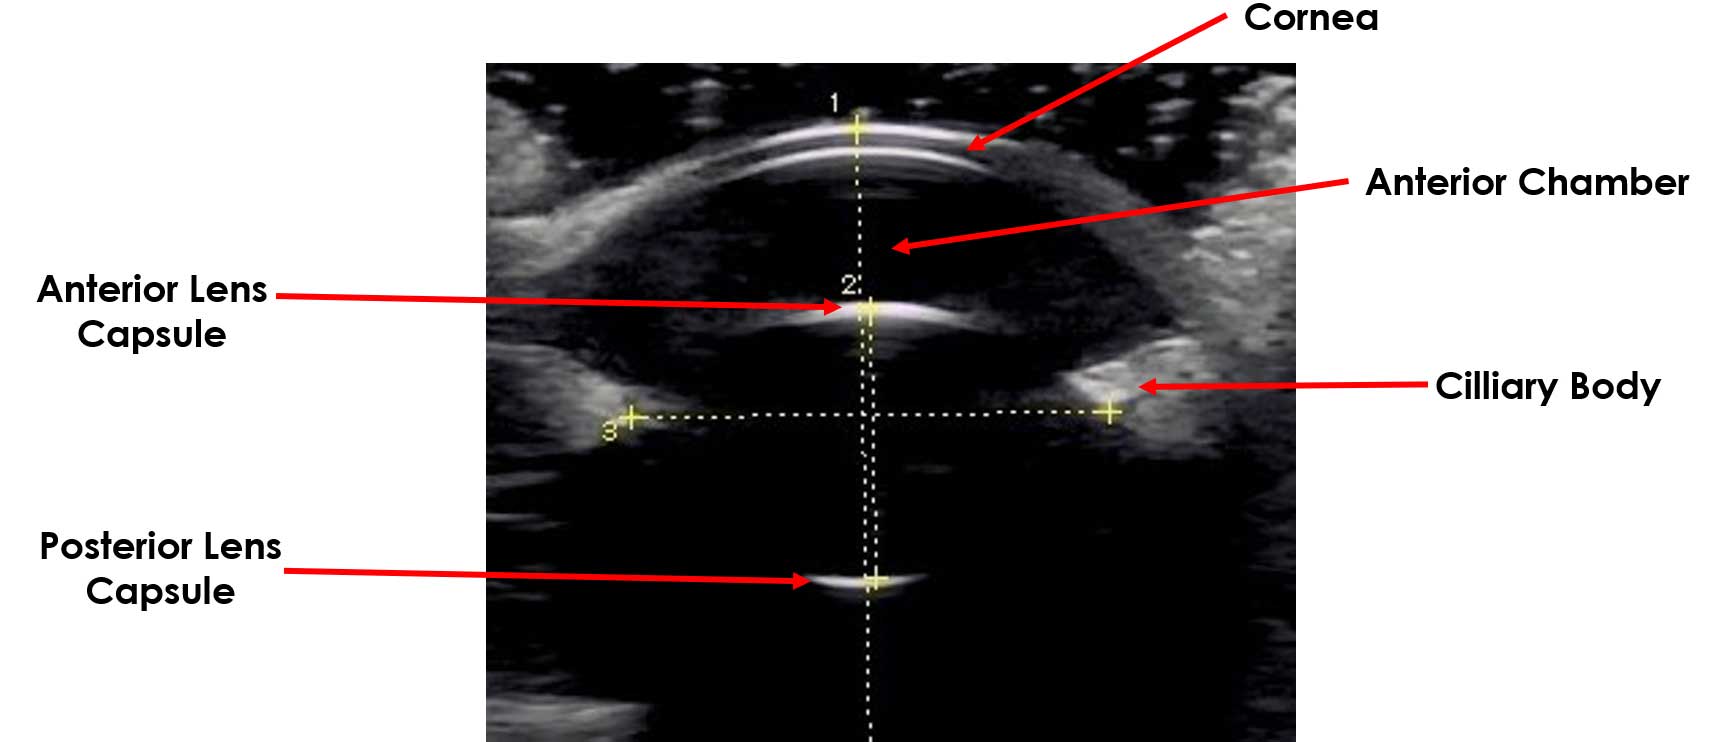
The anterior and posterior lens capsule are highly echogenic, and on ultrasound appear as bright convex and concave lines, respectively (Figure 6).
The normal internal fibres and nucleus of the lens appear anechoic. The curved echogenic anterior capsule of the lens will cause the ultrasound waves to refract, leading to some loss of detail at edges of the posterior lens capsule – this is an artefact known as edge shadowing.
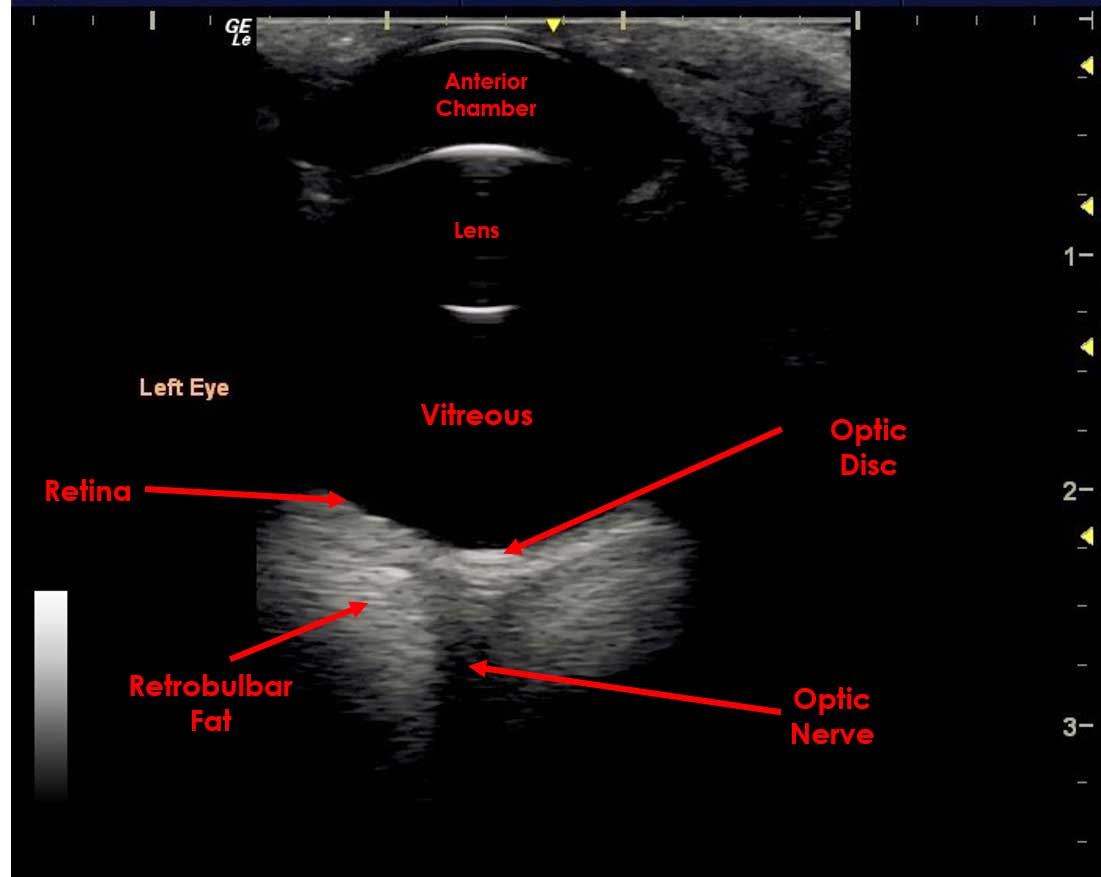
The vitreous body is an anechoic region that fills the majority of the posterior segment of the globe.
In the normal eye, the posterior tissue layers of the globe are indistinguishable and appear as a single hyperechoic curved line – representing the combined layers of the retina, choroid and sclera.
The optic disc may be visible in the posterior wall of the globe and appears as a recessed, hyperechoic area (Figure 7).
The retrobulbar space includes the extraocular muscles, retrobulbar fat, and the optic nerve and vasculature. The extraocular muscles appear as thin hypoechoic lines with the more hyperechoic retrobulbar fat forming triangular areas medial to the muscle bands. The optic nerve appears as a central hypoechoic/anechoic linear area.
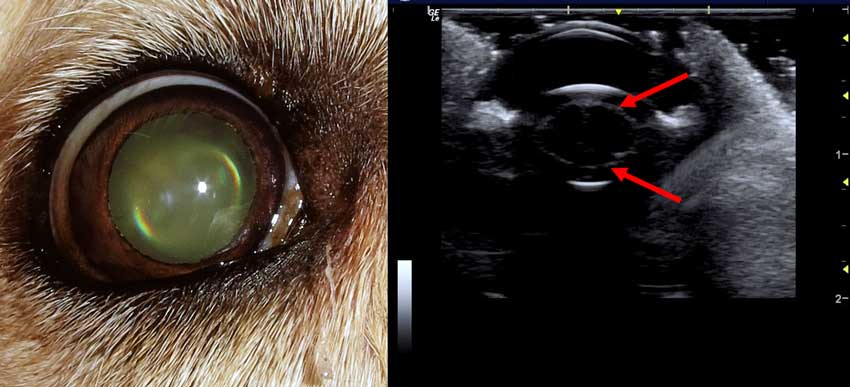
In middle-aged dogs (usually older than seven years of age) the nucleus of the lens will increase in density. This is known as nuclear sclerosis. Ultrasonographically, it will appear as a thin curvilinear echogenic line within the lens, running parallel with the lens capsule (Figure 8). This can be mistaken for cataract formation.
Measurement of the ocular structures (ocular biometry) can be performed using ultrasound. Traditionally, biometry was performed using amplitude or “A-mode” scanning, which displayed a simple graphical representation of a single beam of ultrasound. In this mode, the amplitudes of the returning echoes are plotted on the Y axis and time is plotted on the X axis4.
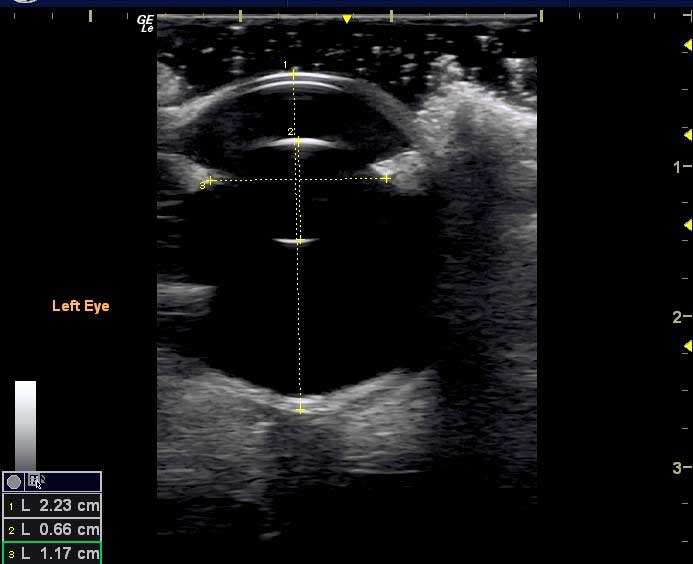
A-mode is rarely used in clinical practice, but comparisons between A-mode and B-mode (brightness mode – the standard ultrasound mode used in clinical practice) ultrasonography have been made5. B-mode measurements are now performed in patients for ocular biometry6 (Figure 9) and the repeatability of B-mode ocular biometry measurements has been described7.
Part two will focus on the appearance of a variety of pathological conditions.