9 Jun 2021
Diego Rodrigo Mocholi
Job Title
In veterinary medicine, patients are unable to self-report their pain. Therefore, experimental and clinical research is focusing on areas to determine objective quantification and categorisation of acute and chronic pain.
Haemodynamic variability recording during the maintenance of anaesthesia has shown promising results in companion animals. A recent multiparametric scale for chronic pain in dogs may help to unify values to stage the severity of canine OA and to standardise the management of pain.
Video recordings in painful cats have been useful in developing a tool to categorise severity of pain. Impaired mobility and reduced activity are shown during chronic inflammatory and pain diseases; therefore, monitoring the intensity of activity during a treatment seems a suitable measurement to establish pain management efficacy.
Heart rate variability (HRV) analysis is a non‑invasive monitoring based on the changes in the amplitude between R waves due to modifications in heart rate (HR) frequencies derived from a continuous ECG recording.
HRV fluctuations provide information about the autonomic nervous system activity, showing three typical spectral peaks:
Previous studies have shown a decrease in HF values during light analgesia and no changes in HRV during adequate nociception – analgesia balance (analgesia nociception index [ANI]) in anaesthetised humans.
ANI is recorded in the monitor as a numerical scale from 0 (high sympathetic activity) to 100 (high parasympathetic level). During a respiratory cycle, parasympathetic tone presence is responsible for a minor effect on HRV, in which HR decreases during a brief period of time in the expiration phase then increases during the inspiratory phase, the respiratory sinus arrhythmia.
In cases with an absence of parasympathetic tone, this respiratory influence is dampened and the amplitude between R waves is modified, establishing a value to assess sympathetic activity.
A parasympathetic tone activity (PTA) index monitor has lately been used in veterinary medicine to predict responses after a nociceptive stimulus. Few studies have shown that haemodynamic changes associated with nociception are preceded by changes in HRV.
Thirty dogs undergoing elective procedures were included in a clinical study to assess PTA monitoring values compared to haemodynamics recording (HR and blood pressure) during the perioperative anaesthesia period. PTA monitoring showed a significant decrease during both the time of clamping the drapes and the surgical incision, and during specific retrospective time periods associated with haemodynamic changes. The dynamics variations in PTA values (-18%) were associated with a feasible prediction of haemodynamic changes within a five‑minute period (Mansour et al, 2017).
The same research group assessed – in a different clinical study – the use of different premedication drugs (morphine, acepromazine and morphine, and medetomidine and morphine) and their effect on the PTA index. It found PTA and its dynamic variations were associated with a fair performance to facilitate detection of nociception during the intraoperative period (Mansour et al, 2020).
In one study, electrical nociceptive stimulus at different intensities (low, medium and high) were applied in nine dogs induced with propofol and maintained with sevoflurane. PTA showed a good prediction of nociceptive stimuli at intensities (low) than those eliciting cardiovascular changes, whereas no significant differences were seen at higher intensities (Aguado et al, 2020).
Canine OA (COA) is the most widely studied degenerative disease, related to a chronic pain model, in small animals.
The COA staging tool (COAST) has been developed as a proposed instrument to encourage veterinarians for diagnosing COA.
Two phases repeated at specific interval times are important for understanding COA in individual patients.
Both the owner and veterinarian are involved in the COA assessment to establish the dog’s stage in the degenerative process.
First grading data includes the pet owner observations in a non-clinic environment, which is collected and recorded by completion of a validated clinical metrology instrument (CMI; the Canine Brief Pain Inventory, the Helsinki Chronic Pain Index or Liverpool OA in Dogs). CMIs are not interchangeable and veterinarians should use one of them to extrapolate the information to the COAST (Table 1).
| Table 1. Canine OA staging tool owner grading (home/non-clinic) | |||
|---|---|---|---|
| Clinical metrology instrument | Degree of dog’s discomfort | ||
| 0 or very low score or “not clinically affected” | ☐ | None | ☐ |
| Low score or “mildly affected” | ☐ | Low level | ☐ |
| Medium score or “moderately affected” | ☐ | Moderate level | ☐ |
| High score or “severely affected” | ☐ | Unbearable | ☐ |
Grading by veterinarians is also crucial during the first stage of the COAST. A multiparametric scoring has been included to help unify data between clinicians (Table 2).
| Table 2. Canine OA staging tool veterinary grading (clinic) | |||||
|---|---|---|---|---|---|
| Effect on static posture | Effect on motion | ||||
| Normal | • Static posture appropriate for breed • Appropriate limb loading • Appropriate bodyweight distribution between forelimbs and hindlimbs |
☐ | Normal | • Symmetry • Appropriate weightbearing • Appropriate bodyweight distribution • Fluent gait |
☐ |
| Mildly abnormal | • Subtle abnormality of limb loading • Subtle shift in static bodyweight distribution |
☐ | Mildly abnormal (subtle changes) | • Motion possibly affected at some gaits or with some activities • Subtle stiffness in gait • Subtle changes in bodyweight distribution • Subtle asymmetry • Subtle lameness • No difficulty rising (getting up) |
☐ |
| Moderately abnormal | • Obvious abnormality in limb loading • Obvious shift in static bodyweight distribution |
☐ | Moderately abnormal (obvious changes) | • Consistent abnormalities in motion at all gaits and activities • Obvious stiffness in gait • Obvious changes in bodyweight distribution • Obvious reduction in use of affected limb • Obvious decrease in stance phase • Some difficulty rising (getting up) |
☐ |
| Severely abnormal | • Restless when standing • Reluctance (difficulty)to stay standing • Severe shift in static bodyweight distribution • Severely abnormal limb loading |
☐ | Severely abnormal (very obvious changes) | • Struggles to move/reluctant to move • Severe lameness usually present • Severe weight shift • Marked difficulty rising (getting up) |
☐ |
The information is collected by a full orthopaedic exam, in which the vet categorises the degree of pain, and the severity of affecting movement and functionality to each joint (Table 3).
| Table 3. Canine OA staging tool grading of the joint (clinic) | |||||||
|---|---|---|---|---|---|---|---|
| Pain on manipulation | Passive range of movement (ROM) | Radiography | |||||
| None | ☐ | Normal | ☐ | No signs of OA | • If preclinical “at risk”, the dog may have radiographic evidence of risk factors such as dysplasia and/or trauma | ☐ | |
| Mild | ☐ | Mildly abnormal | • Minimally reduced ROM • No crepitus • Slight joint thickening |
☐ | Mildly abnormal (subtle changes) | • Early signs of OA • Minimal osteophytes |
☐ |
| Moderate | ☐ | Moderately abnormal | • Obvious decrease in ROM • Muscle atrophy • Obvious joint thickening |
☐ | Moderately abnormal (obvious changes) | • Obvious osteophytes | ☐ |
| Severe | ☐ | Severely abnormal | • Extremely limited ROM • Crepitus • Extreme muscle atrophy • Severe joint thickening • Loss of anatomical normality on palpation • Anatomical misalignment |
☐ | Severely abnormal (very obvious changes) | • Advanced osteophytes • Remodelling |
☐ |
Every joint and its progression is independently assessed and monitored over time, using as only guide treatment the most affected joint if its grading is higher than the overall grading values.
Both grading steps results are compared to categorise the severity of COA in the patient by the following principles:
The highest grade recorded for any of the parameters assessed equates to the stage of OA in that dog, as long as a big difference between two or more grades does not exist.
Advantages of COAST are:
Facial expressions have been analysed and included in human and veterinary grimace scales as an important component of pain expression and its recognition in patients with non-verbal communication.
A facial action coding system is an objective tool to assess facial expressions by measuring individual facial movements or action units (AUs). This coding system is able to recognise the activity of a sole muscle or a group of muscles.
Recently, the Steagall Laboratory group (University of Montreal Faculty of Veterinary Medicine) has developed and validated the Feline Grimace Scale (FGS; Evangelista et al, 2019; Figure 1).
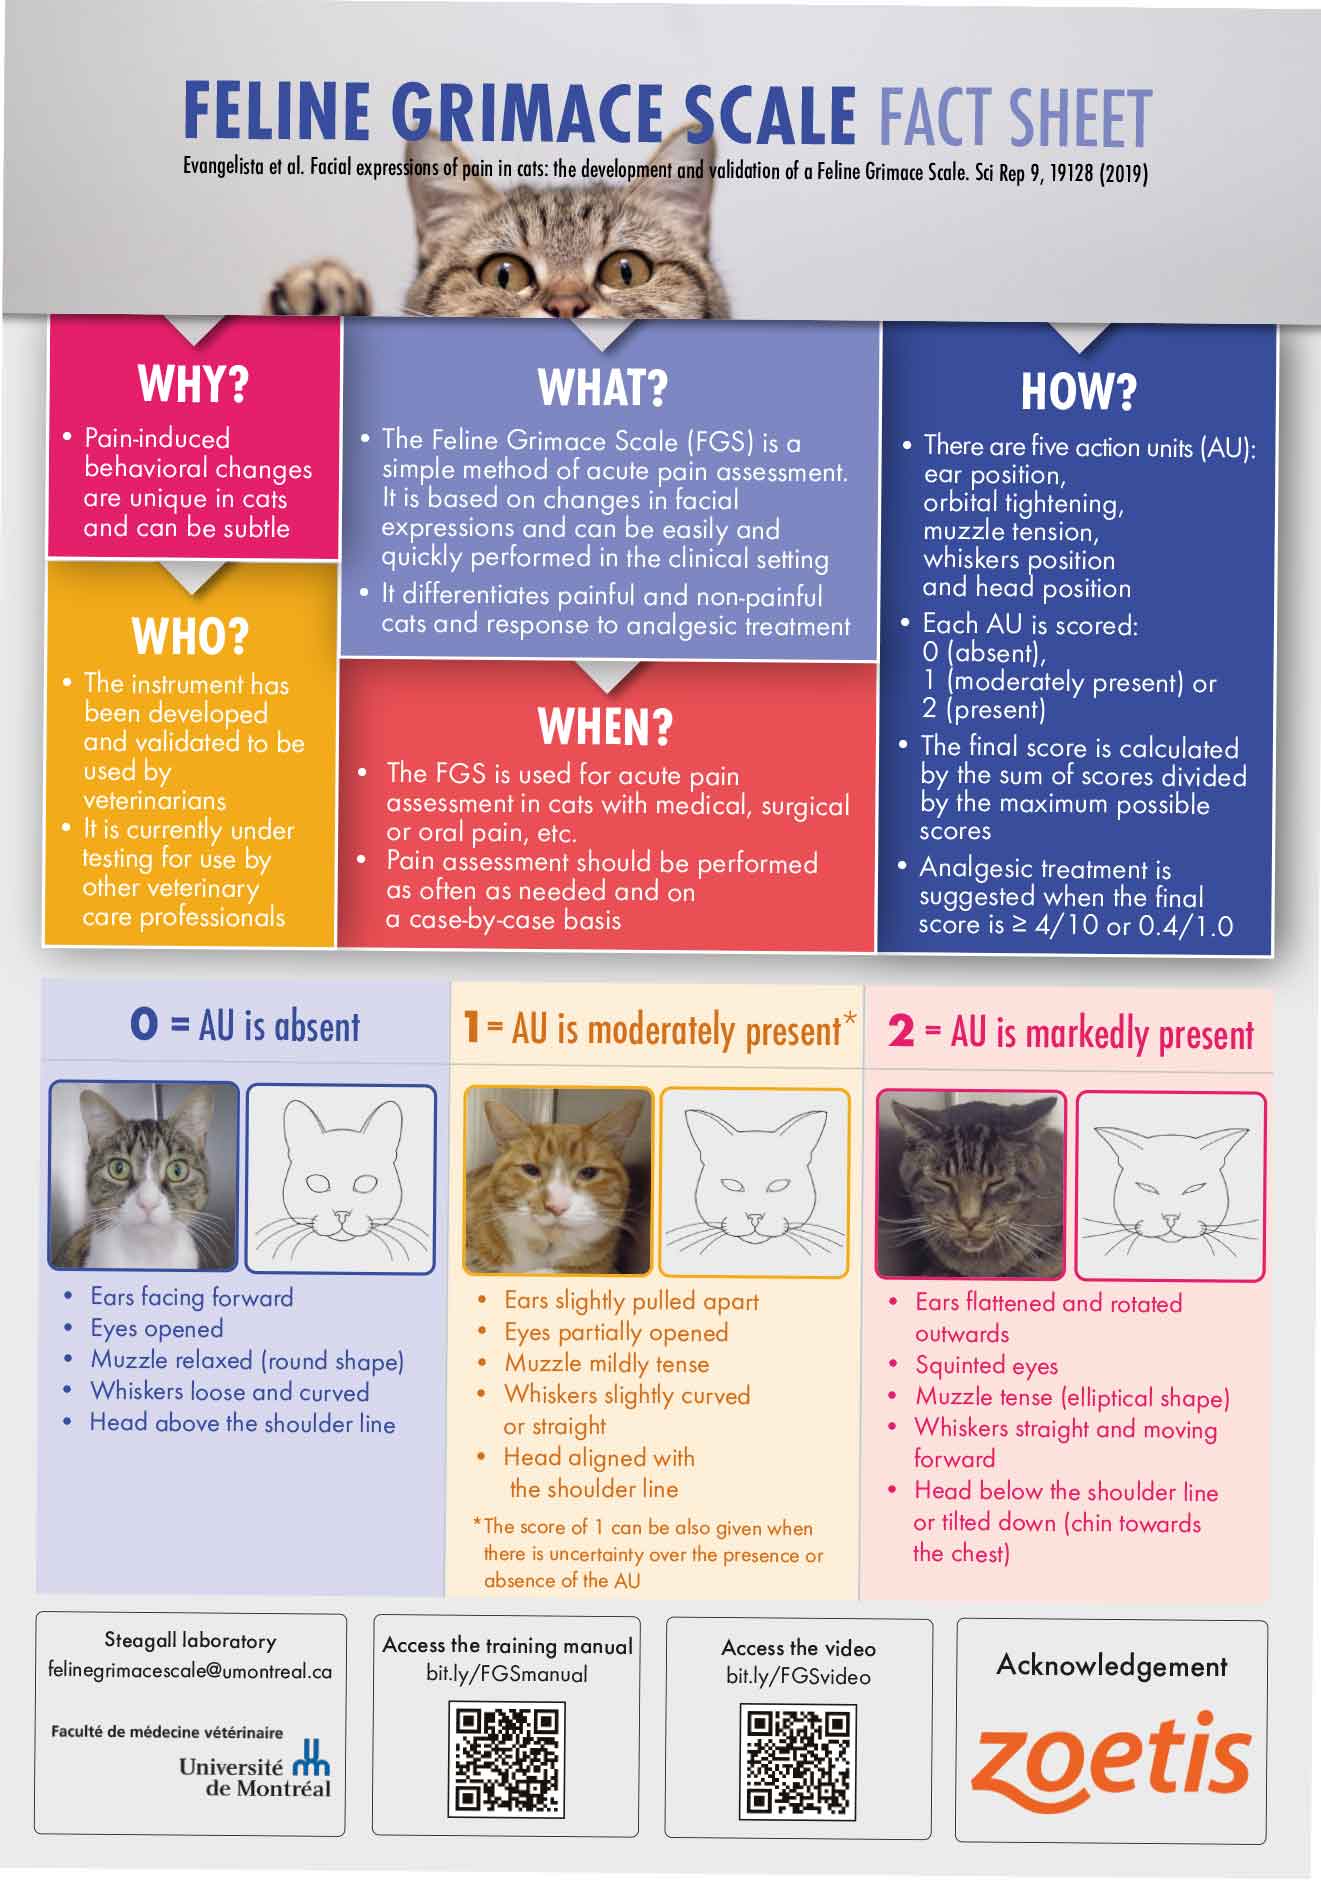
Thirty‑nine cats with abdominal pain were included in part one of the study (FGS description), in which five AUs were defined:
These AUs in the FGS are consistent with ears action descriptors and AUs previously described in a feline-specific coding scheme (the Cat Facial Action Coding System). Also, the geometric morphometric in the study showed good relation with identified changes in the facial shape after a nociceptive stimulus.
For the second part of the study (FGS validation), 35 client-owned cats were recruited. The FGS demonstrated high construct validity compared to control groups, a very strong correlation with the Glasgow composite measure pain scale for acute pain in cats, moderate (muzzle and whiskers) to good (ears, eyes and head position) inter-rater reliability of AU, excellent intra-rater reliability 30 days after the first scoring, excellent internal consistency (final FGS Cronbach’s alpha coefficient = 0.89) and a high discriminative ability (accuracy).
In clinical research, 65 cats undergoing an ovariohysterectomy were sedated with an IM combination of acepromazine and buprenorphine, followed by propofol induction and isoflurane maintenance (Evangelista et al, 2020).
Both real-time and video-recorded FGS (RTFGS and VRFGS, respectively) were recorded at baseline, 15 minutes after sedation, and at 2, 6, 12 and 24 hours after extubation. Images from the VRFGS assessment were analysed 6 months later by the same observer who previously performed the RTFGS recording.
Good agreement between both FGSs was observed, and no significant differences compared to baseline were observed at 15 minutes and 24 hours in both groups. Although no differences compared to baseline were found in the VRFGSs, RTFGS high significant values were recorded from 1 to 12 hours after extubation.
No effect was detected on AU in both FGSs with either sedation or balanced anaesthesia. Both FGSs detected the analgesic effect one hour after rescue analgesia administration in 30 cats.
In a different study from the same research group, 24 cats underwent dental procedures. Multimodal anaesthesia and analgesia consisted of acepromazine and hydromorphone premedication, followed by propofol induction and isoflurane maintenance. Meloxicam was also administered and locoregional techniques were performed (Watanabe et al, 2020).
FGS images were recorded with or without the caregiver’s presence before and after rescue analgesia, six hours after extubation and six days later. Four raters analysed the images captured during the hospitalisation days.
Good (muzzle) to excellent (ears, eyes, whiskers and head position) average inter-rater reliability was observed. Overall, no differences were observed during the caregiver’s presence.
Chronic pain and inflammatory diseases are responsible for minor activity (decreased mobility and distance) in canine and feline patients.
During the past decade, actigraphy (non‑invasive method of monitoring rest/activity periods) has been introduced and studied in veterinary medicine as a tool to objectively monitor the physical activity of companion animals.
An actigraph unit (or actimetry sensor) is a small device to continually record the motion activity and has an accelerometer as a component to provide valuable information about movement, rotation and body position.
Seventy dogs with COA were recruited in a clinical study to assess the use of an activity monitor (AM) as a tool to determine changes in activity before and during anti-inflammatory treatment (Brown et al, 2010).
Data was collected during 21 days – days 1 to 7 were the baseline values, while days 8 to 21 dogs were randomly assigned to either a placebo or carprofen group.
The carprofen group showed a significant increase in the activity compared to baseline. Also, an increase in 20% of the locomotor activity was recorded in the carprofen group compared to dogs included in the placebo group.
In a prospective study, 59 dogs with COA were randomly divided after a 14-day wash out period into two groups:
AM data (together with subjective owner assessment and bodyweight distribution) was collected from day 14 until day 112 (16 weeks).
Overall, AMs showed an increase during the first two weeks of the study then gradually decreased. Significant differences in activity between groups were seen between week one, and both weeks two and seven. AMs only showed significant differences between weeks one and six in the maintenance group (Wernham et al, 2011).
A clinical study was conducted in 26 dogs with degenerative joint disease during 28 days of treatment after either a single IV injection of a canine-specific monoclonal antibody (NV‑01) or placebo. AM recordings showed a 10% increase in motor activity during four weeks with the NV-01 single treatment compared to the placebo group (Lascelles et al, 2015).
In a more recent study, dogs with COA received meloxicam for two weeks after a previous two-week baseline. Age, sex, weight, impairment disease level and forelimb or hindlimb pain data were collected, and an AM assessed patient locomotor activity (Muller et al, 2018).
Few factors affected the AM:
In a study of 13 cats with owner‑assessed decreased activity, painful arthritic joints and no clinical abnormalities in the blood work, activity was recorded during a three-week period after either meloxicam or placebo administration.
A 9.3% increase in activity was observed in the meloxicam group compared to baseline values (Lascelles et al, 2007).
A recent study about the use of meloxicam at three different doses (0.025mg/kg, 0.04mg/kg and 0.05mg/kg) in 42 cats with OA revealed an increase in activity intensity during the 28 days with treatment administration compared to placebo group (Guillot et al, 2013).
In a clinical study, 34 cats with a history of degenerative joint disease were enrolled in three different groups – placebo, or SC injection of a feline-specific monoclonal antibody at 0.4mg/kg or 0.8mg/kg. AMs reported a significant increase in the locomotor activity from week four to week eight in the treatment groups compared to the placebo group (Gruen et al, 2016).